The Big One
Methods
Georeferencing, Geometry Editing
Software
ArcGIS Pro 3.2.2, ArcGIS Online, ArcGIS StoryMaps, DaVinci Resolve 18.6, GIMP 2.10
Data
USGS M9 ShakeMap data (CSZM9); Global Earthquake Archive - PAGER/USGS; DEM Global Mosaic- NCEI/NOAA; RIFT model animation - PTWC/NOAA; Evacuation Maps -DOGAMI/NOAA; Living Atlas (ESRI)
year
2024
Objective
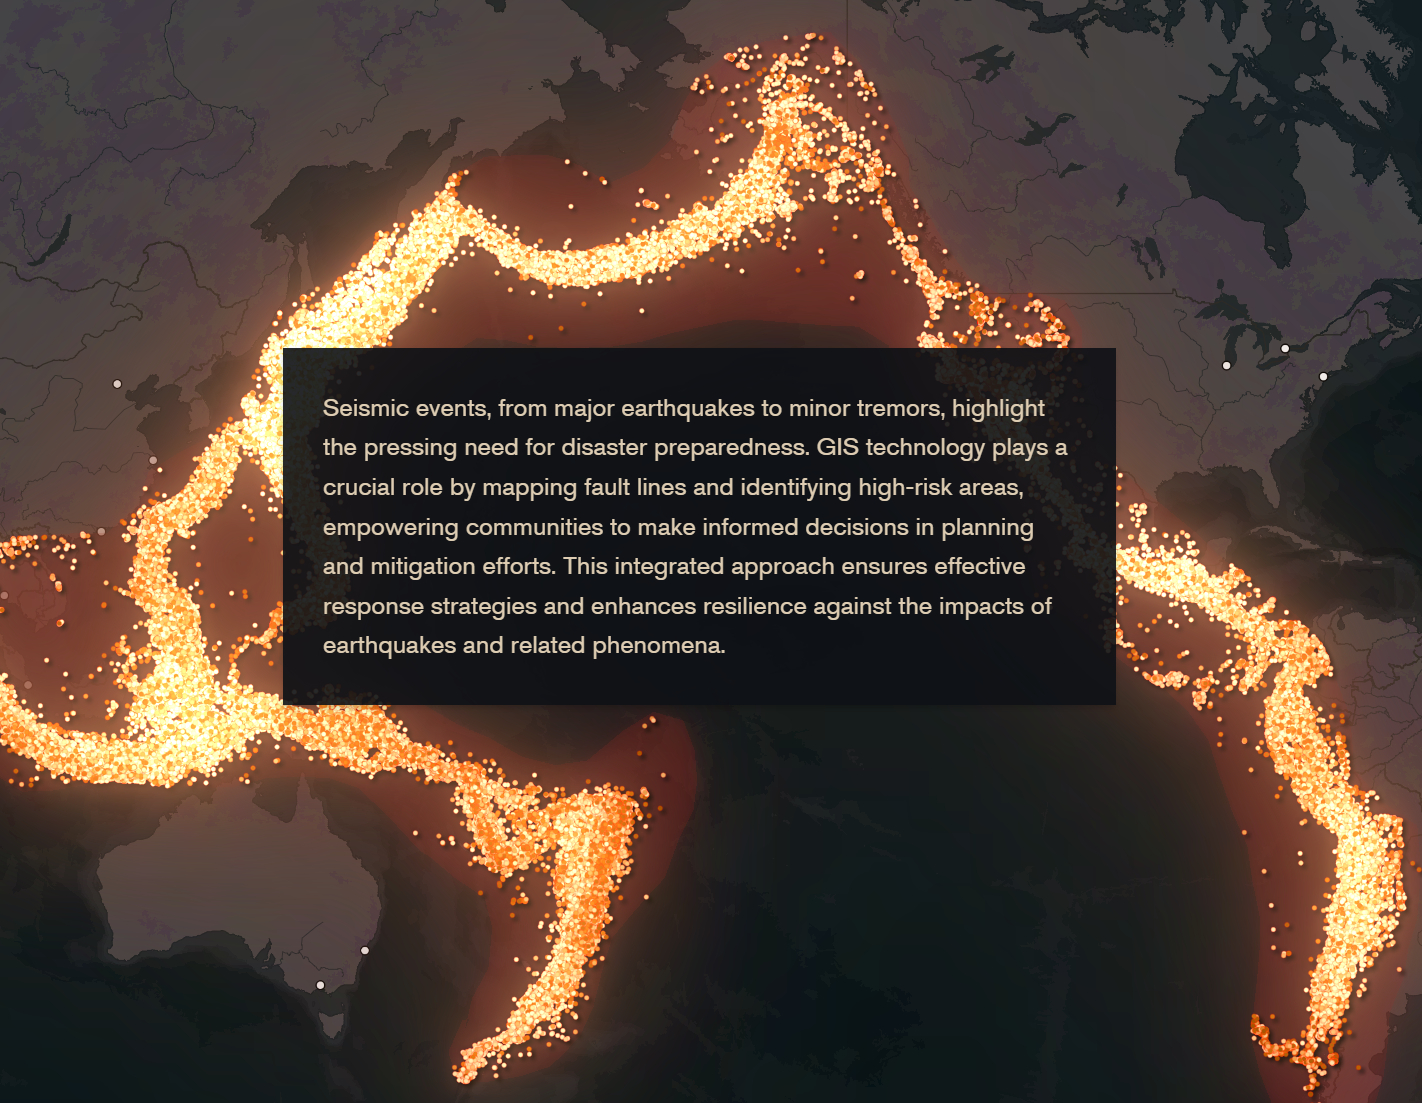
This ArcGIS StoryMap was created to explore the complexities of the West Coast's and the Pacific Northwest's seismic destiny in great detail. With a focus on earthquake forecasting, disaster preparedness, urban resilience issues, and the outlining of the Pacific Ring of Fire and Cascadia Subduction Zone, this exploration is broken up into multiple sections with the goal of illuminating the relationship between human civilization and the unyielding forces of nature.
Methods
1. Data Collection: Collected a variety of datasets, including point, line and polygon vector data, as well as raster data, to support multiple visualization applications.
2. Georeferencing: Tsunami inundation and evacuation pamphlets for Canon Beach, Oregon were manually georeferenced to a WGS84 World Imagery Layer and then exported from ArcGIS Pro into AGOL via respective web service layers I created.
3. Media and Design: Utilized Davinci Resolve to edit and create video title headers from Creative Commons footage for section introductions and other video elements. Employed GIMP for the editing and formatting of additional media content.
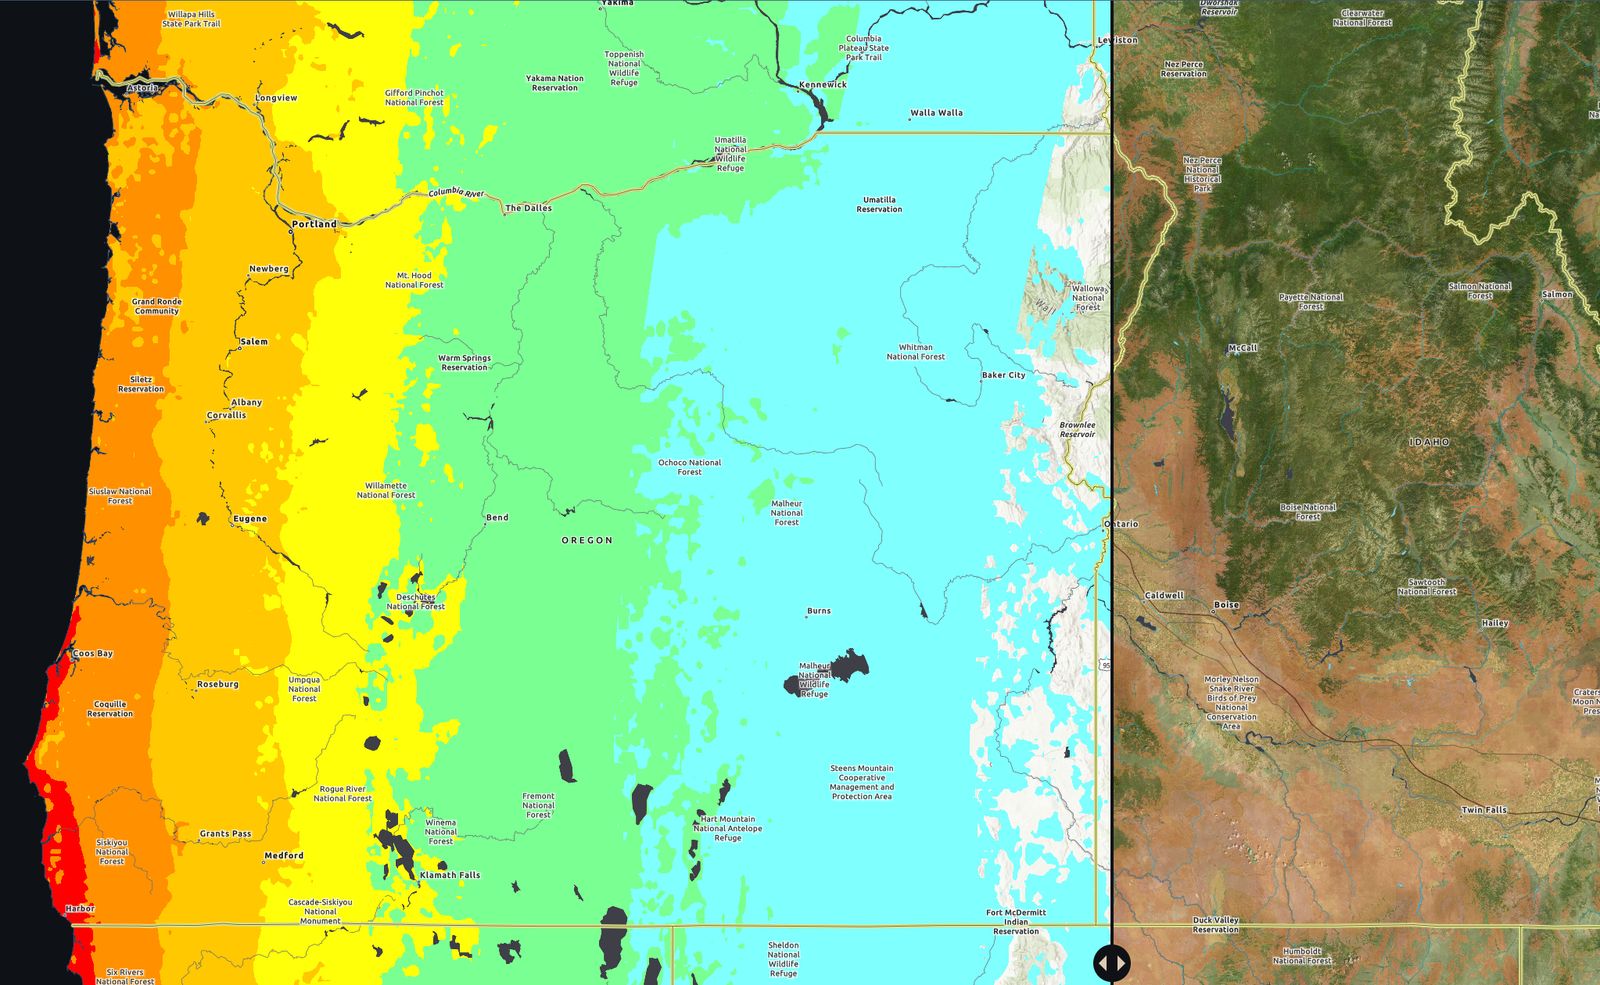
4. Raster Data Refinement: Used USGS data (CSZM9), to create raster feature sets for the Cascadia ShakeMap Scenario swipe map element.
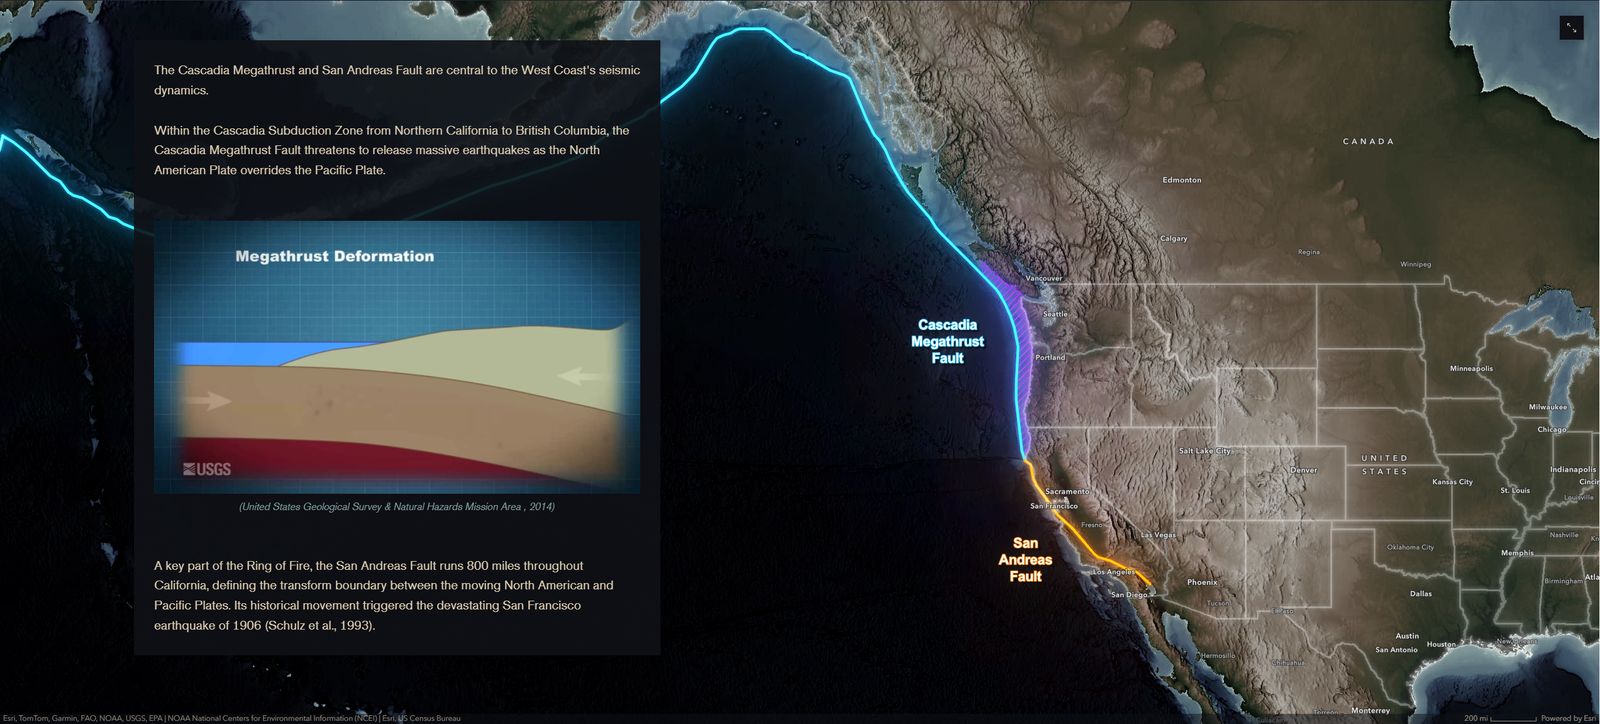
6. Geometry editing: Created multiple polygon layers for visualizing plate tectonics, employing both freehand and standard feature creation methods.
With this project, I set out to source multiple applications of GIS technologies within the preparation and education of the impending "Big One" earthquake. I wanted to find data that would paint a compelling picture of the impact of this disaster, as well as a way to best communicate the narrative I wanted to carry with the storymap presentation. I was able to track down terrific dataset from the USGS and NOAA, and learned a lot about utilizing ArcGIS StoryMaps in the process.


