Agate Gravel Bed Detection
Methods
Remote Sensing, Raster Analysis
Software
ArcGIS Pro 3.2.2, ArcGIS Online, ArcGIS StoryMaps, GIMP 2.10, Microsoft Excel, LibreOffice Calc 24.2
Data
OSIP 4-band imagery (2018, 1ft); Sentinel-2 L2A SWIR data (2018, 20m); USGS Historical Hydrological Data (2020-2024); Living Atlas (ESRI)
year
2024

METHODS
1. Data Acquisition: Collected high-resolution OSIP imagery 2018 (R,G,B and NIR bands), Sentinel-2 L2A Low and High Range SWIR bands (Bands 11 & 12), USGS hydrological data (2020–2024), and field-collected GPS points marking known gravel bed locations. These diverse datasets provided the spectral, spatial, and contextual information necessary for a detailed analysis.
2. Study Area Definition: Defined the study area as a 750-foot buffer around hydrography features within the Wilson River region. This buffer ensured the analysis focused only on areas relevant to gravel bed formation and agate deposition, reducing computational load while maximizing precision.
3. Index Calculations: Developed the Gravel Bed Extraction Index (GBEI) using the formula:(SWIR2 - NIR) / (SWIR1 + Red).This formula highlighted surfaces with mineral content while suppressing interference from vegetation and water. The calculation leveraged Sentinel-2’s SWIR bands for mineral sensitivity and OSIP’s NIR and Red bands for vegetation and soil contrast.
4. Masking with NDVI and NDWI: Calculated NDVI (Normalized Difference Vegetation Index) to mask out vegetated areas (NDVI > 0.3) and NDWI (Normalized Difference Water Index) to exclude water features (NDWI > 0.005). These masks refined the GBEI results by focusing the analysis on exposed surfaces likely to contain gravel beds.
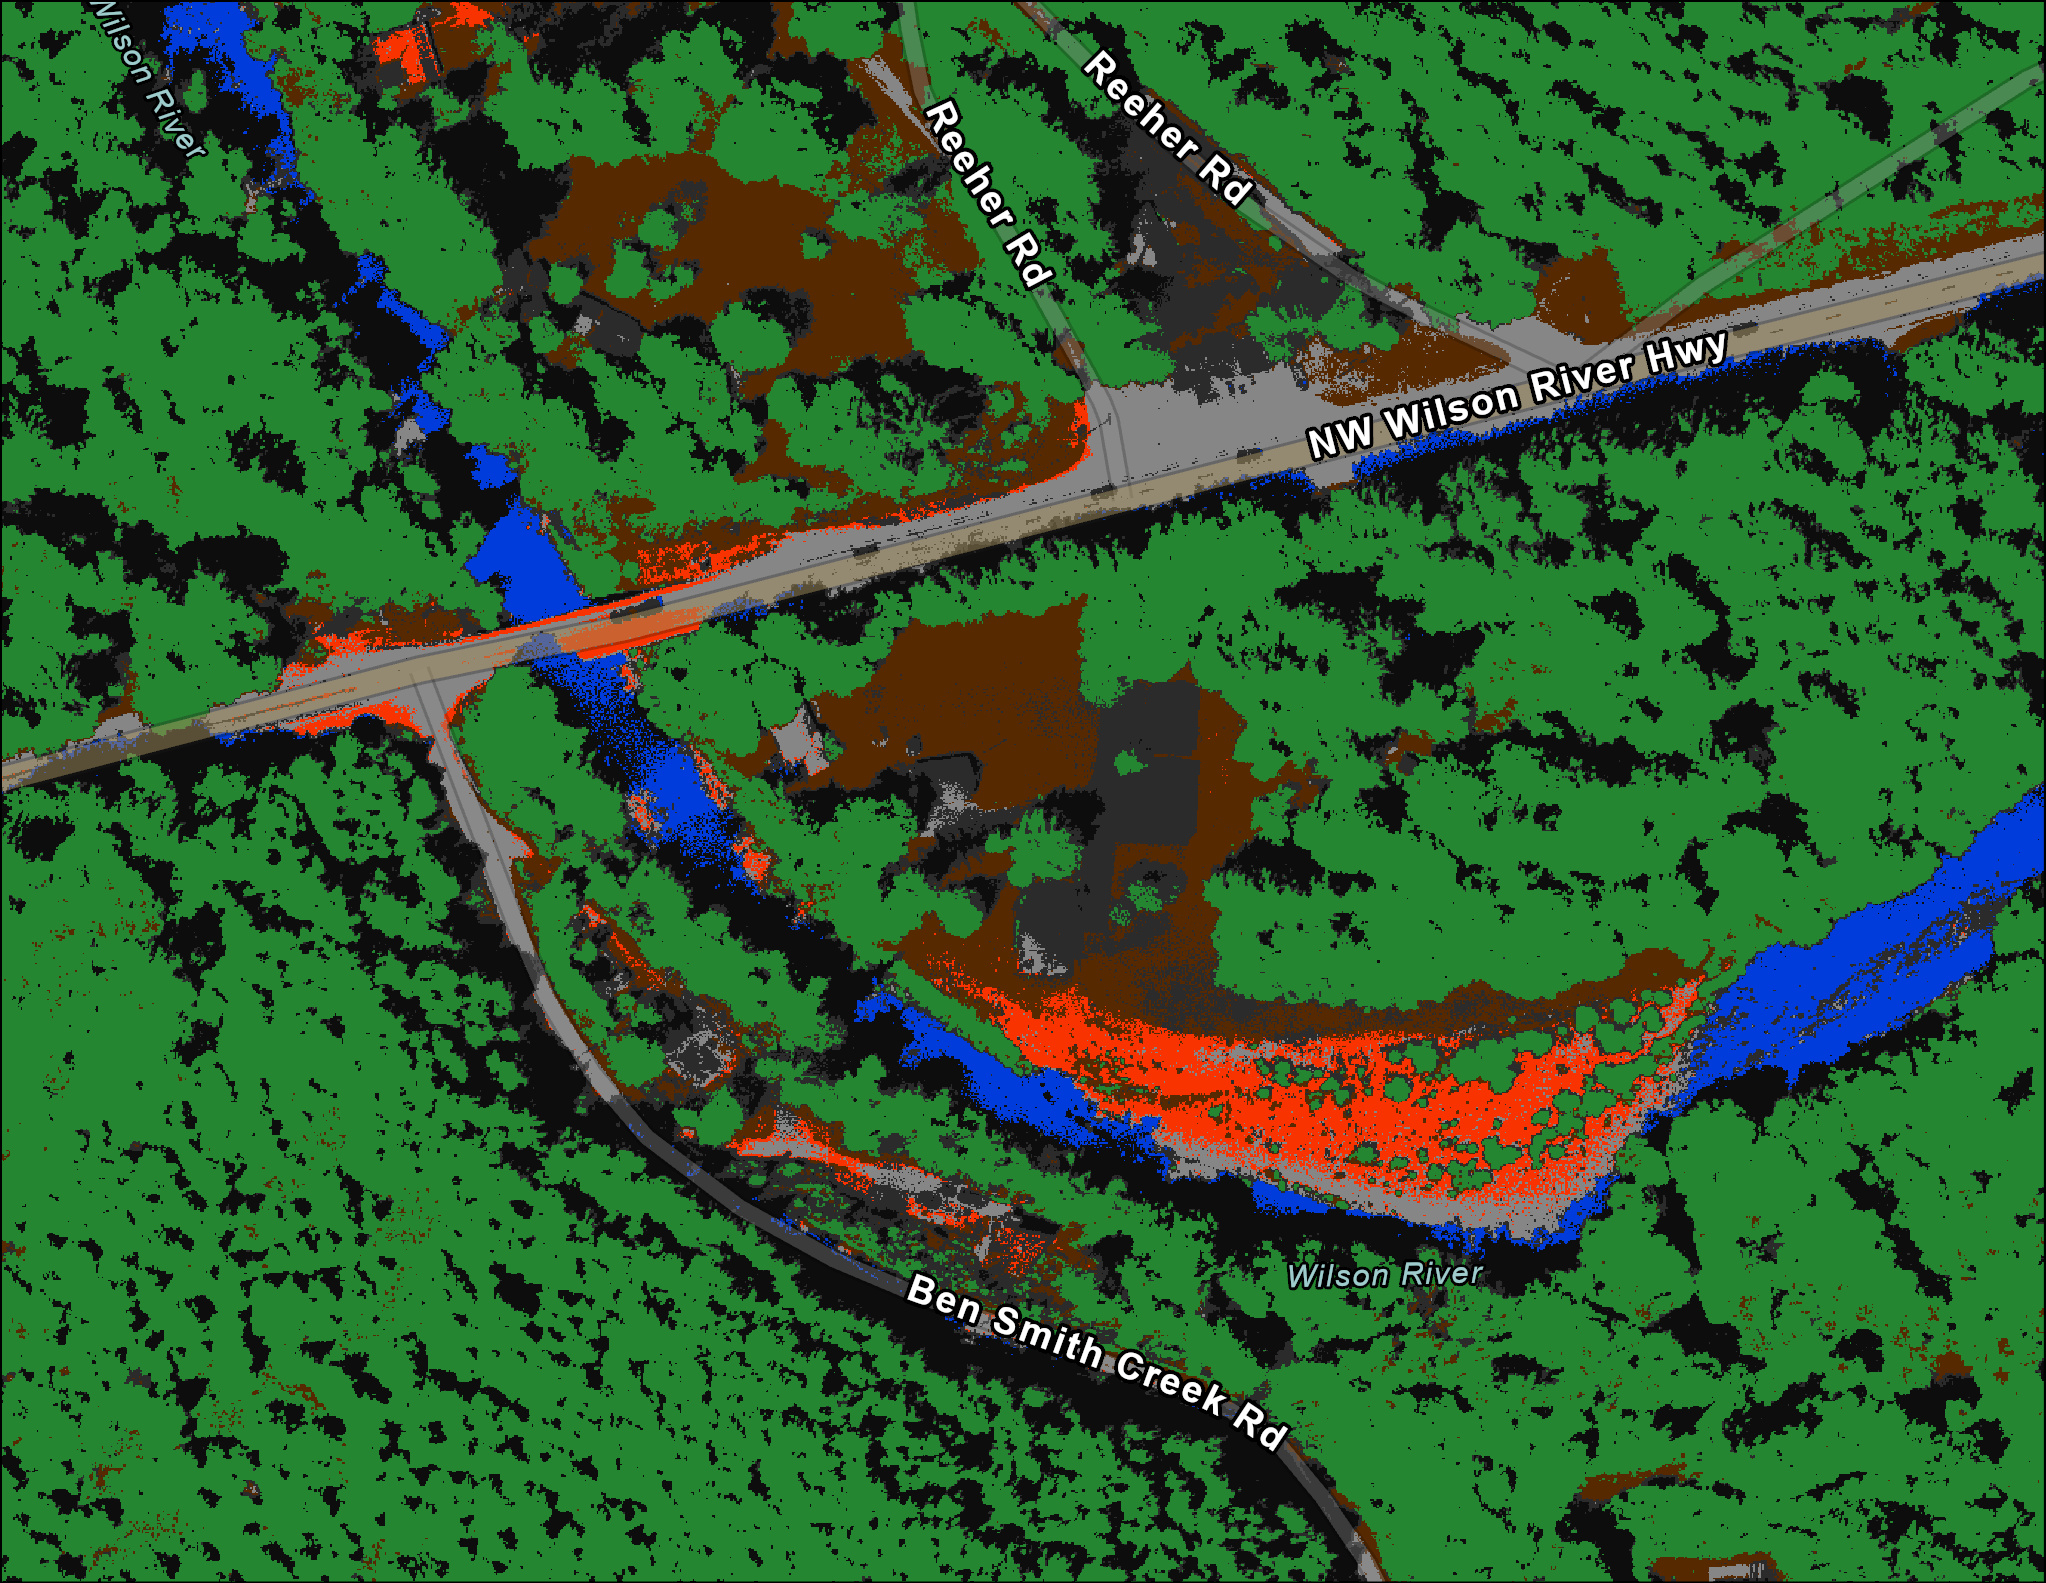
5. Supervised Classification: Trained a supervised classification model using field-collected GPS points as training samples. This process classified the study area into specific surface types, including gravel beds, vegetation, and soil. The classification ensured a detailed segmentation of potential gravel-rich zones.
6. Validation: Validated the final results by comparing predicted gravel bed zones with field-collected survey points. This strong alignment between these prediction and real-world location helped to confirm the accuracy and reliability of this workflow and analysis. This provides a foundation for similar application to other river systems for further gravel bed detection.
Process
This project aimed to locate gravel beds with high agate potential along Oregon’s Wilson River using a GIS-based workflow. The study combined OSIP high-resolution RGB and NIR imagery with Sentinel-2 SWIR bands for spectral analysis. Data preparation included reprojecting, normalizing, and clipping raster layers to a study area defined by a hydrography buffer.
After calculating the GBEI, vegetation and water masks (NDVI and NDWI) were applied to refine the results. Supervised classification, trained with field data, further delineated gravel bed zones. Validation showed strong alignment between the predicted zones and site-collected points.
Results
The analysis identified areas of high gravel bed potential within the Wilson River study area. These results, validated against field-collected data, demonstrated the effectiveness of the GBEI and supervised classification workflow.
Conclusion
This workflow and analysis successfully pointed out gravel beds likely to contain agates with general accuracy, highlighting the value of combining spectral analysis with supervised classification. This method can be adapted for other river systems with similar data, broadening its application for agate discovery in gravel beds.


